 There are several technical indicators that are used to pinpoint entry and exit points. These vary from oscillators, which identify overbought and oversold conditions to moving average crosses, which identify short-term trend reversals. The most popular oscillators are the stochastic indicator and Wilder's RSI while the best moving average combination is called Moving Average Convergence Divergence (MACD).
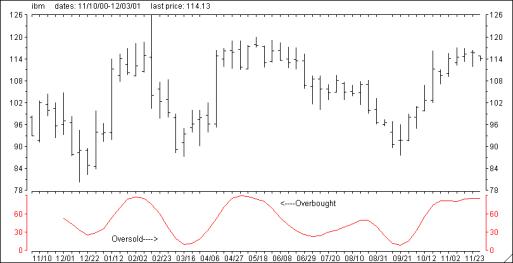
The stochastic oscillator is very good at identifying overbought and oversold conditions. It compares where a security's price closed relative to its trading range over x-time periods. Values range from 0 to 100. Readings over 80 signal overbought conditions (bearish), while readings below 20 are regarded as an oversold situation (bullish).
There are two stochastic oscillators, Slow %K and Fast %K. Both are constructed by comparing a stocks closing price to its trading range over the five previous days. Slow %K is then smoothed with a three-day simple moving average while Fast %K does not. As might be expected, Fast %K is much more erratic than Slow %K and therefore not as reliable.
The graph located below is a weekly chart of IBM with the Slow %K stochastic oscillator plotted at the bottom. Both overbought (over 80) and oversold (under 20) areas are labeled. Note that the week ending 3/16/00, Slow %K dipped below 20 when IBM closed at 95. This represented a very oversold situation and an excellent time to purchase IBM shares. IBM proceeded to rally over the next six weeks, topping out at 118 as Slow %K soared to over 80 signaling another overbought condition.
 The Right Stock At The Right Time®