 The Right Stock At The Right Time®
| The Right Stock At The Right Time® |
|
||
|
|
Point & Figure Chart Formations
Assume that a stock has declined from 40 to 20 over a ten-day period. The chart would reflect a string of twenty O's depicting the decline. Then the stock rallies over three days back to 24. This would result in the creation of a new column called a reversal column, which consists of four X's. For a reversal column to be added to the chart there must be a minimum of three boxes. As the stock continues to climb, additional X's would be added to the column until such time that a new reversal column, consisting of three or more O's, is produced
Since there is no time reference on the chart, X's and O's are replaced by numbers and letters that represent the months of the year. Number 1-9 indicates January (1) through September (9). The letters A, B & C are inserted for October, November and December.
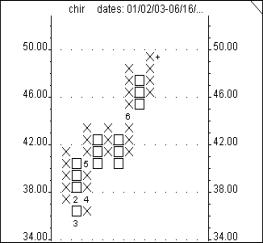 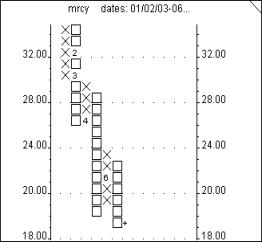
The following table summarizes the historical, average results of stocks that have broken out of a Double Top-Double Bottom formation as compiled by a Purdue University study and reproduced from A.W. Cohen's book, Three Point Reversal Method of Point & Figure Technical Analysis.
                        DOUBLE TOP          DOUBLE BOTTOM
% Of Time Profitable:      80.3%                82.1%
Average % Gain:            38.7%                22.7%
Average Time for Gain:     11.5 months          4.7 months
The following are examples of a Triple Top breakout (PBY - Bullish) and a Triple Bottom breakout (WVCM - Bearish).
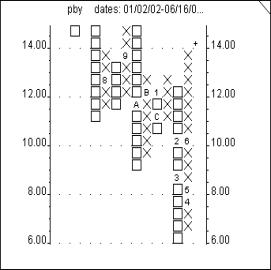 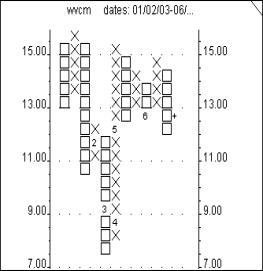
The following table summarizes the historical, average results of stocks that have broken out of a Triple Top-Triple Bottom formation as compiled by a Purdue University study and reproduced from A.W. Cohen's book, Three Point Reversal Method of Point & Figure Technical Analysis.
                         TRIPLE TOP          TRIPLE BOTTOM
% Of Time Profitable:      87.9%                93.5%
Average % Gain:            28.7%                23.0%
Average Time for Gain:     6.8 months           3.4 months
Market Edge follows over 4,400 stocks on a daily basis and reports Double Tops/Bottoms, Triple Tops/Bottoms and Quadruple Tops/Bottoms breakouts. In addition, the Point & Figure Early Alert report lists those stocks that are in the process of forming one of these formations and closed within 5% of the breakout price. This report enables traders to recognize potential breakouts and to take action as they occur rather than after the market closes. These reports are located in the Advanced Tools area. In addition, the Smart Chart feature of Market Edge includes Point & Figure charts.
|
 Point & Figure charting dates back to the inception of modern market analysis. It is a unique form of charting in that it is only concerned with price movement, ignoring time constraints. Typically, Point & Figure charts are constructed using a box size that equals one point and requires a 3 box movement for a column reversal. A stock that closes over 100 would require a 3-point move to earn either an X or an O designation. Stocks that close at 20 or below need only a 1/2 point move on a daily basis to generate either an X or O entry.